Plot a clutter map
A simple plotting routine for visualizing the clutter map. You’ll need to specify several paramters for the routine:
Path to clutter map netCDF
Path to output directory for plots
Scan type (i.e. PPI, RHI)
Map type (i.e. daily or composite)
Polarization (i.e. horizontal or dual)
Maximum range to plot in kilometers
Site abbreviation
Instrument name
The routine can plot maps of both PPI and RHI scan types, as well as both daily and composite clutter maps.
# import commands
import matplotlib.pyplot as plt
from .plot.plot_clutter_map import plot_clutter_map

# specify all parameters
clutter_map_netcdf = '/__my_path_to__/__my_clutter_map.nc__'
output_directory = '__my_path_to__/__my_figure_output_directory__/'
scan_type = 'ppi'
map_type = 'composite'
polarization = 'horizontal'
max_range = 5
site = 'ena'
inst = 'xsapr2'

plot_clutter_map(clutter_map_netcdf,
                 output_directory,
                 scan_type,
                 map_type,
                 polarization,
                 max_range,
                 site,
                 inst
                 )
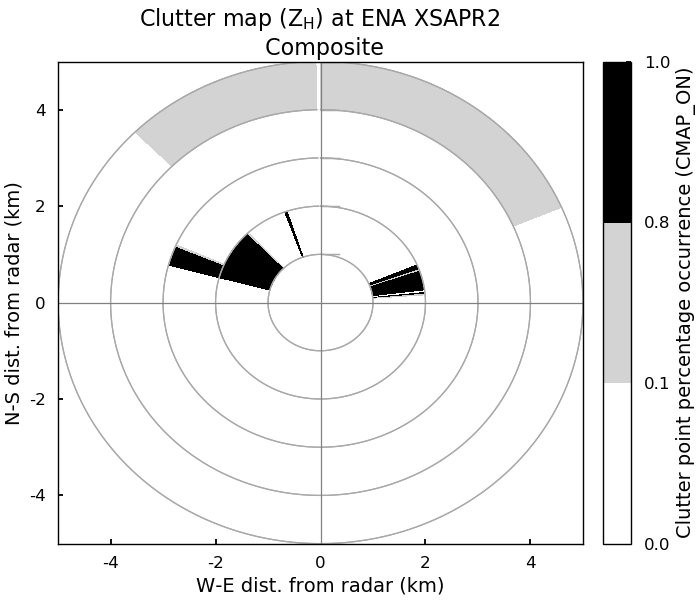
The plot generated is found in the specified output directory and for the parameters listed in the example, will look like this: