Plot a time series of RCA
Depending on your needs, you can select a routine from the plot_rca_timeseries module to plot a time series of RCA from one, two, or three radars in one figure.
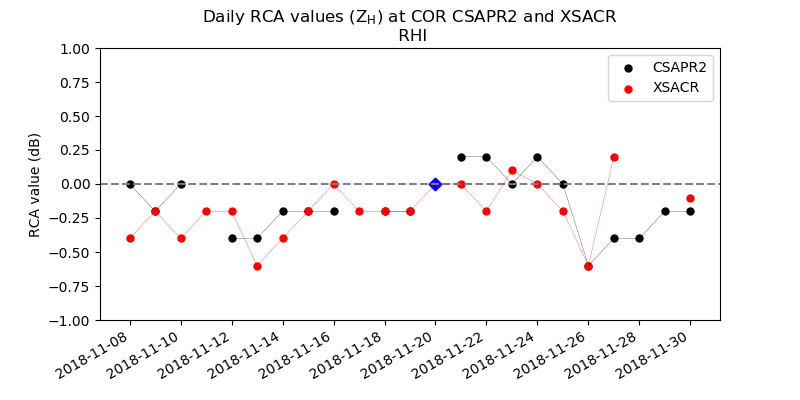
The example below will plot daily RCA values from two radars, CSAPR2 and XSACR. You will need to specify several parameters, which are:
Path(s) to daily RCA CSV file(s)
Path to output directory for generated figures
Baseline date, to note visually on the plot (YYYY-MM-DD)
Polarization (i.e. horizontal or dual)
Scan type (i.e. PPI or RHI)
Site abbreviation
Instrument name(s)
# import commands
from .plot.plot_rca_timeseries import plot_rca_timeseries_tworadar

# specify parameters
rca_file1 = '__/your_path_to__/__your_daily_rca_1.csv__'
rca_file2 = '__/your_path_to__/__your_daily_rca_2.csv__'
output_directory = '__your_path_to__/__your_figure_directory__/'
baseline_date = '2018-11-20'
polarization = 'horizontal'
scan_type = 'rhi'
site = 'cor'
inst1 = 'csapr2'
inst2 = 'xsacr'

plot_rca_timeseries_tworadar(rca_file1,
                             rca_file2,
                             output_directory,
                             baseline_date,
                             polarization,
                             scan_type,
                             site,
                             inst1,
                             inst2
                             )
The output figure from this example script would look like: